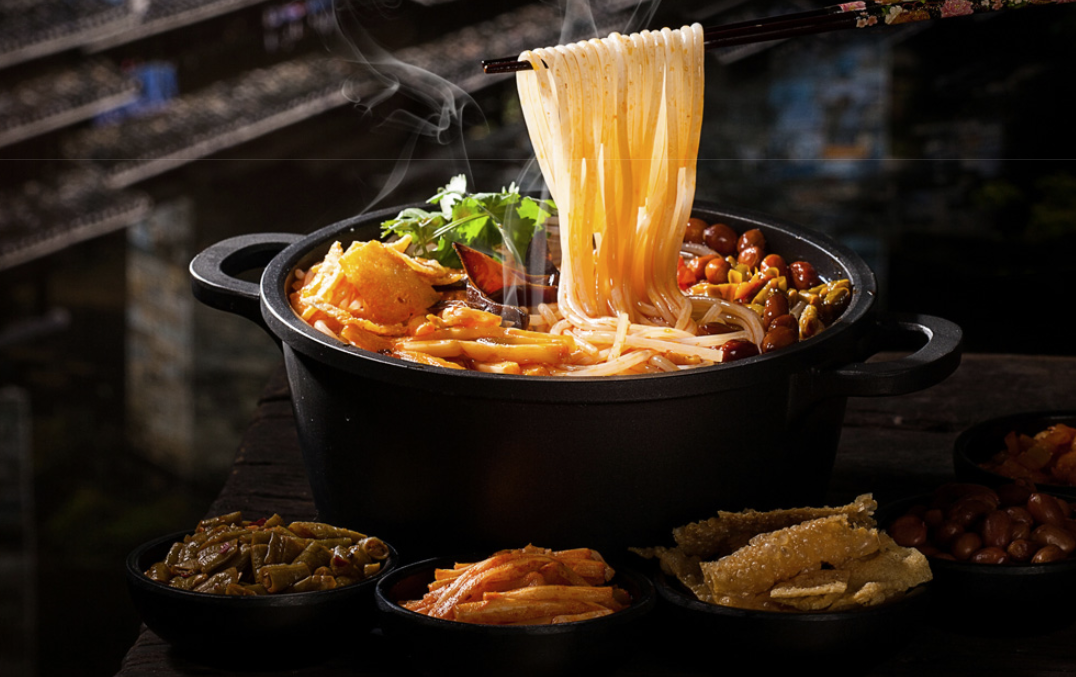
China’s catering revenue reached 4.6721 trillion yuan in 2019, an increase of 9.4 percent over the previous year, according to the National Bureau of Statistics. However, from January to September 2020, the national catering income was only 2.5226 trillion yuan, down 23.9% from the same period last year. The snack industry showed strong resilience during the epidemic, and the recovery was better than that of the catering industry as a whole.
The snack industry is the main tone of China’s catering industry. According to incomplete statistics, there are about 5 million snack shops in China, which is currently the main form of the catering industry.

The catering industry is rich in categories, but the degree of concentration is not high. This is especially true for snacks. According to big data of Meituan, there are 17 sub-categories in which snack industry orders accounted for more than 1 percent in 2019, followed by fast food, Spicy Hot Pot, noodles, rice noodles(米粉), porridge, steamed buns, clay pot chicken, fried chicken kebabs, rice noodles(米线) and dumplings.
In 2019, orders for fast food accounted for 43.7% of the snacks category, while orders for Spicy Hot Pot, noodles, rice noodles, and porridge accounted for 6.0%, 5.8%, 5.6%, and 5.6%, respectively.
At the same time, consumer demand for fried chicken kebabs, steamed buns, Korean snacks, Hong Kong snacks, stewed duck neck, rice noodles, and other categories increased greatly, and the orders for these categories increased by 146.9%, 92.9%, 90.6%, 90.1%, 67.8%, and 62.1% respectively in 2019 compared with the same period last year.
With the enhancement of social purchasing power and the growth of per capita GDP, the consumption trend of urban and rural residents in China is obvious. In the past, the per capita consumption of snacks was more than 30 yuan, but now more and more consumers are willing to spend 40-50 yuan or more on snacks.
Big data of Meituan shows that in 2019, the per capita consumer price of snacks is 33.9 yuan, the proportion of orders over 30 yuan is 54.0%, and the proportion of transaction volume is 73.8%, which has become the main consumption range of snacks. And the growth rate of orders in the price range of 41-50 yuan and above 50 yuan is faster, reaching 40.0% and 45.7% respectively, much higher than the overall growth rate of 35.3% of the snack category.
In 2019, the number of snack merchants with an average transaction price of more than 31 yuan increased positively, while the number of snack merchants with an average transaction price of less than 10 yuan decreased by 37.6%.
In horizontal comparison, although the per capita consumer price of snacks has increased, it only higher than the unit price of beverage stores (28.0 yuan), still far lower than the average price of the catering market (76.9 yuan), there is still a lot of room for improvement in the future.
In recent years, consumers have further developed their takeout habits, and China’s takeout industry has achieved rapid development. According to iResearch, the scale of China’s catering takeout industry in 2019 was 653.6 billion yuan, an increase of 39.3 percent over 2018.
According to big data of Meituan, snacks account for about 60 percent of food takeout orders, and more than 50 percent of transactions. In 2019, snack takeout orders increased by 33.9% compared with the same period last year, and transaction volume increased by 37.4% compared with the same period last year.
Despite the impact of the epidemic, from January to August 2020, the order volume of snack takeout has returned to 106.1% of that of the same period last year, and the order amount has returned to 116.9% of that of the same period last year.
According to the results of a questionnaire survey conducted by the Meituan Research Institute and the China Hotel Association, snack consumers are getting younger and younger, mainly in the 20-35 age group. Among them, the proportion of orders in the 26-30 age group reached 38.1%. “post-90s” and “post-1995” are important consumers of snacks.
In terms of gender, women are the main consumer of snacks, accounting for 57.6% of orders in 2019. At the same time, the spending power of men has increased rapidly, with orders for men rising 44.1% year-on-year in 2019, higher than the increase for women (26.9%).
In contrast, unmarried youth have more consumption time, higher willingness to spend, more diverse consumption scenarios, and more frequent social needs, while the convenience, efficiency, and sociality of snacks meet the consumption needs of unmarried youth. The results of the questionnaire survey show that in 2019, the proportion of snack consumption orders of unmarried groups is as high as 69.9%, and the number of orders of unmarried groups is 2.3 times that of married groups.
Big data of Meituan shows that snack orders in first-tier, new first-tier, and second-tier cities are on a large scale, accounting for 20.1%, 27.6%, and 22.1% of orders, respectively. With the growth of consumer demand for snacks in the sinking market, the demand for snacks in third-tier, fourth-tier, and fifth-tier cities is growing rapidly, with snack orders growing at 37.7%, 43.5%, and 45.5%, respectively.
Snack shops are mostly concentrated in populous provinces, and the provinces with the largest number of snack shops in the country are Guangdong Province, Shandong Province, and Jiangsu Province. Guangdong Province accounts for 10.6% of the total number of snack shops in the country, which is also the most populous province in 2019. Shandong Province accounts for 7.7% of the country’s snack shops, which was the second-most populous province in 2019. Jiangsu Province accounts for 7.4% of the country’s snack shops, which was the fifth most populous province in 2019.

评论