In the grand theater of U.S.-China trade relations, headlines are typically dominated by heavyweight contenders: soybeans, semiconductors, and the sprawling global manufacturing chains that define modern commerce. Yet, beneath these high-profile skirmishes, a far more peculiar, and arguably more revealing, battle has been waged – one fought over the humble chicken foot. Recently, an American netizen named Luis found himself at the center of a surprisingly heated online debate after posting on Xiaohongshu, a popular Chinese social media platform, about what he termed the “U.S.-China chicken feet trade war”.1 The passionate responses from both Chinese and American commentators underscored just how this seemingly insignificant poultry byproduct had become an unlikely symbol in a much larger economic tussle.
You might be thinking, “A trade war… over chicken feet? Seriously?” And that’s precisely why this story is so compelling. It peels back the layers on the intricate, often bewildering, ways global trade actually functions. It reveals how profound cultural differences can sculpt economic realities and create unexpected points of leverage. And it demonstrates how even the most overlooked products, those literally discarded in one nation while prized in another, can become significant pawns in the high-stakes game of international relations.
This isn’t just a quirky anecdote. The saga of the chicken foot, or “paw” as it’s often termed in the U.S. poultry industry, offers a crystal-clear case study. It illustrates how China, by astutely leveraging its colossal market power and a keen understanding of the cultural and economic asymmetries surrounding this particular product, strategically navigated a specific trade conflict to its distinct advantage. In doing so, it left many U.S. suppliers, once dominant in this niche market, facing considerable economic pain and a radically altered trade landscape.1 The chicken feet dispute serves as a potent example of how asymmetric leverage in international trade can play out: one nation’s low-value byproduct is another’s delicacy, and this valuation chasm can be strategically exploited. This “micro-battle” also reflects broader shifts in global economic power, where immense consumer markets like China’s can increasingly dictate terms and reshape global supply chains, even for commodities that might seem minor on the world stage.
The “Phoenix Claws” vs. The Forgotten Part: A Tale of Two Appetites (and Economies)
To understand how chicken feet became an improbable flashpoint in U.S.-China trade, one must first appreciate the chasm in cultural perception and economic valuation of this product between the two nations. What is largely an industrial afterthought in America is, in China, a beloved culinary staple.
“Feng Zhua” (凤爪) – A Chinese Culinary Star
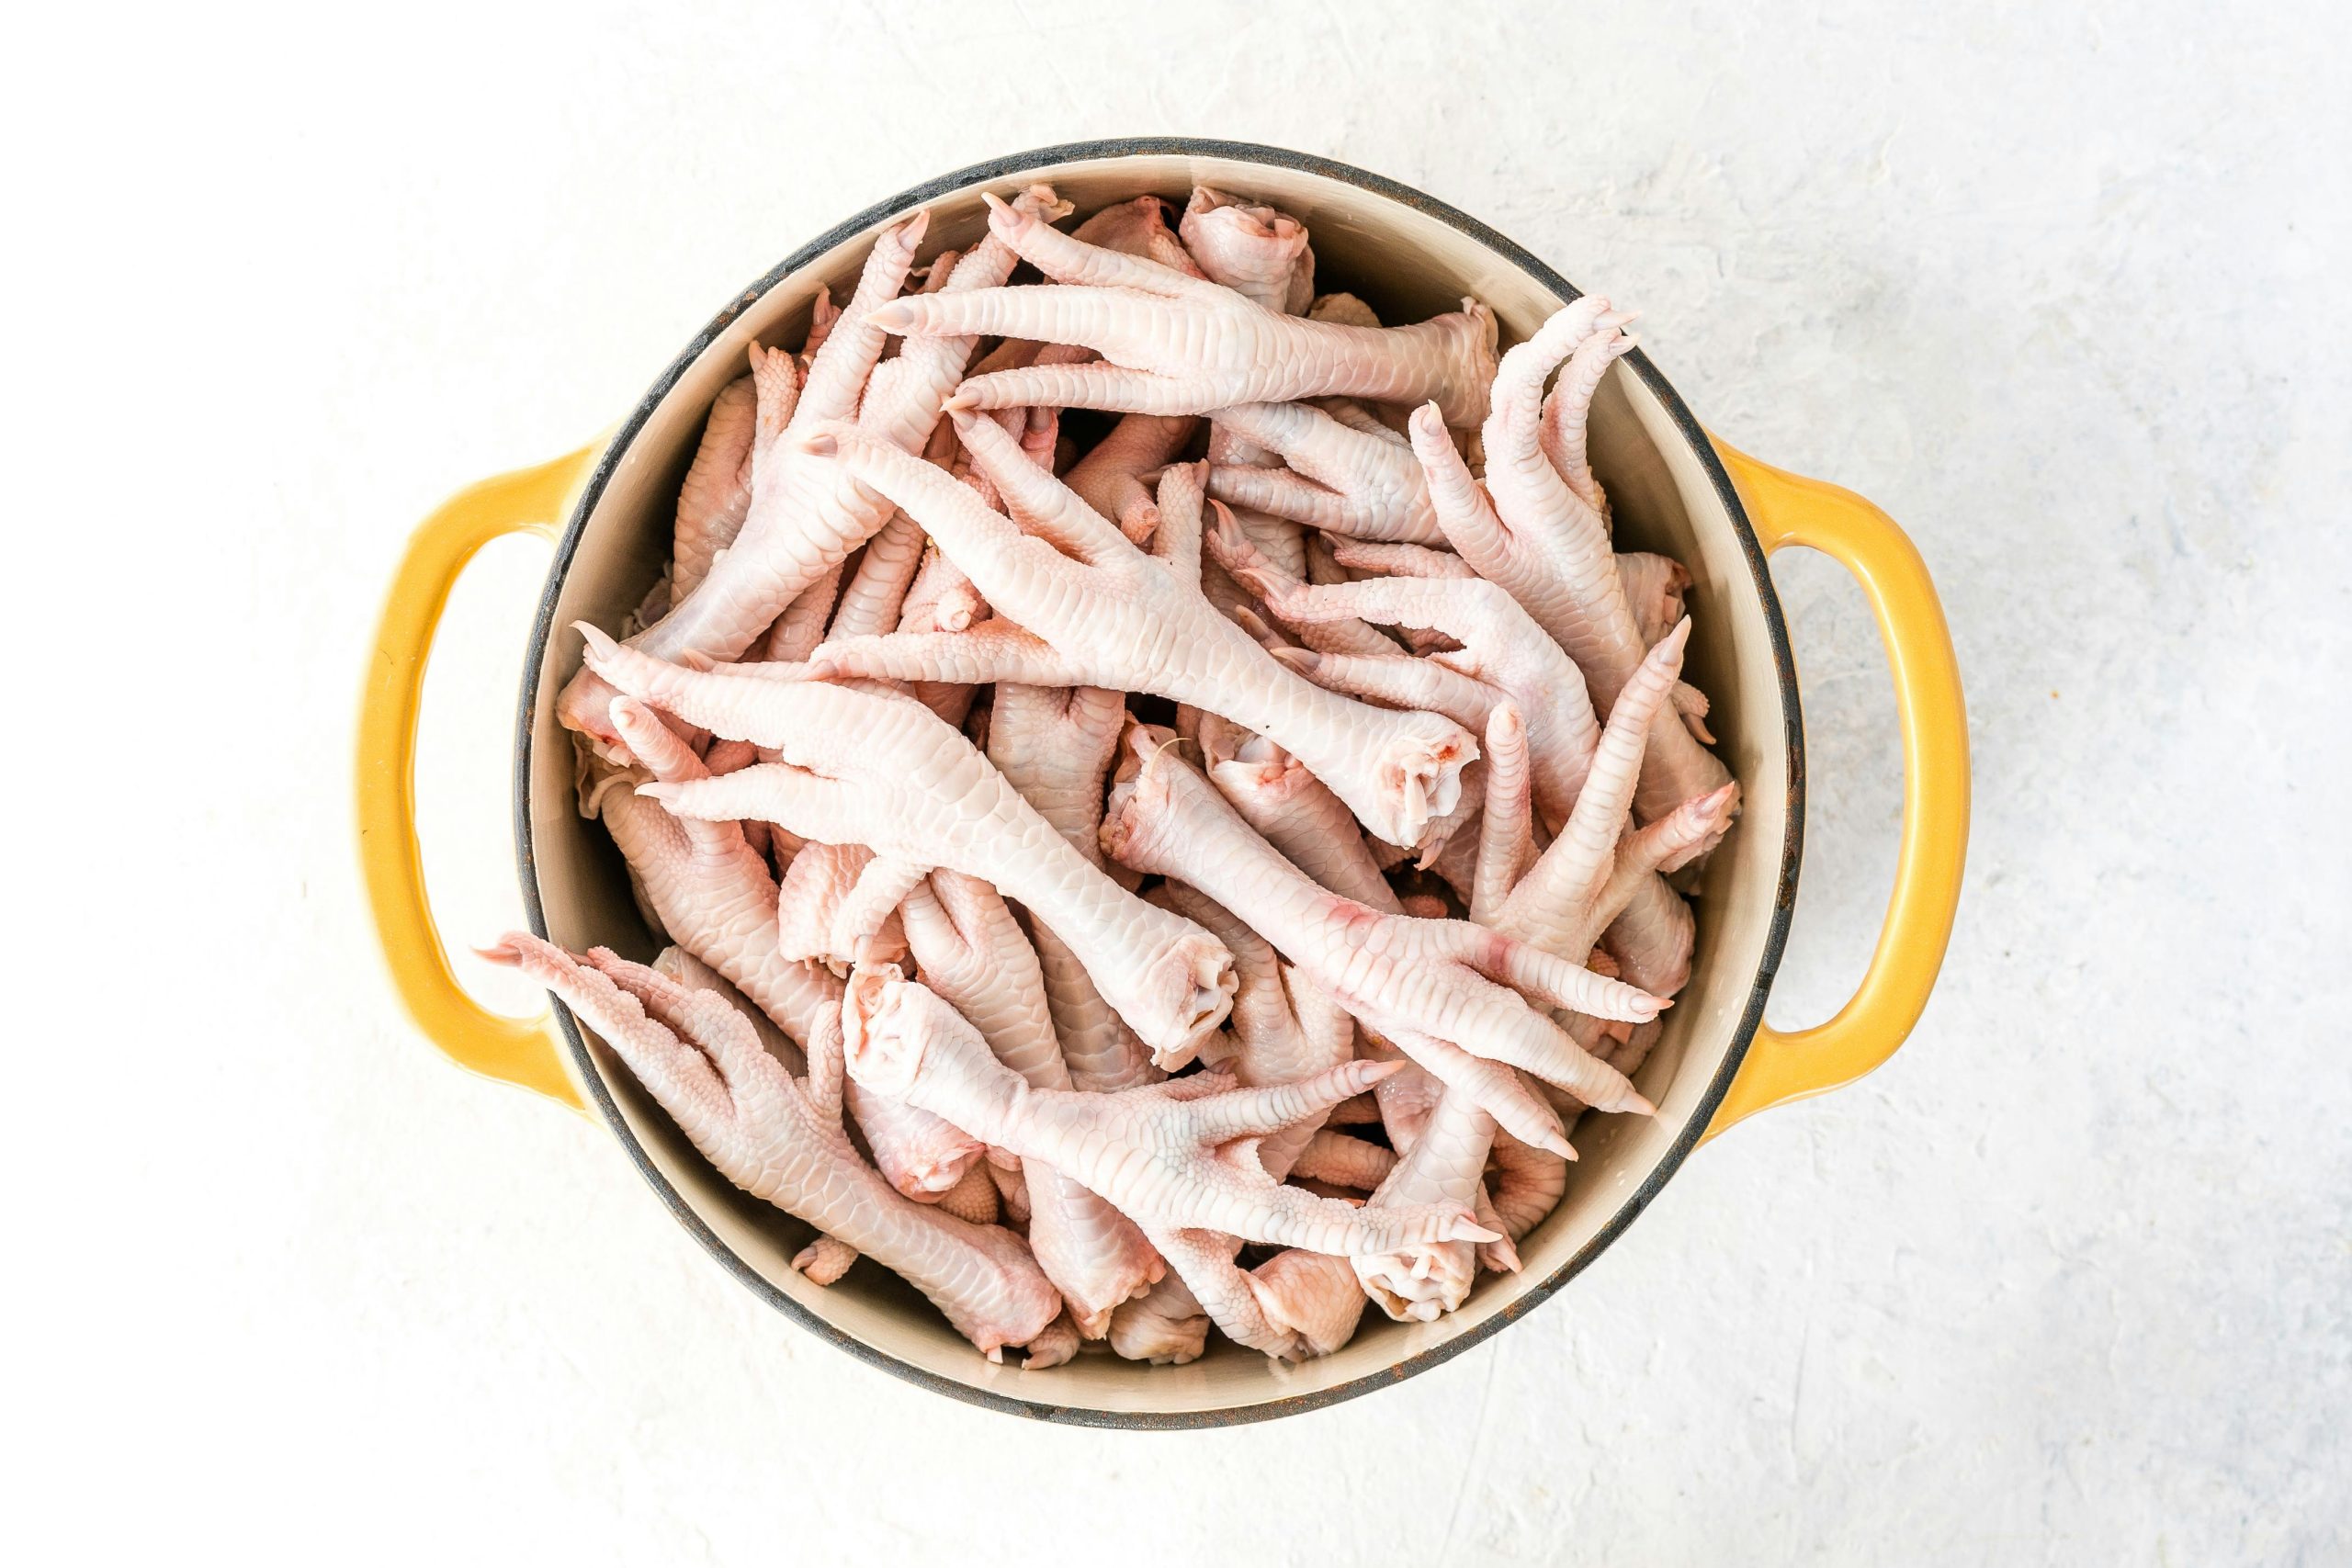
In China, chicken feet, poetically often referred to as “Feng Zhua” or “Phoenix Claws,” are far more than just a food item; they are a cultural institution. They are a star attraction in Cantonese dim sum parlors, where they are typically braised or steamed with fermented black beans, chili, and other spices until the skin and tendons become wonderfully gelatinous and absorb the rich flavors.1 Beyond the “yum cha” table, chicken feet are a ubiquitous snack. You’ll find them simmering in savory broths at street food stalls, featured on KTV (karaoke) menus, and, perhaps most visibly to the casual observer, sold in vacuum-sealed packages in every convenience store and supermarket, marinated in an array of flavors from spicy to sweet-savory. The appeal lies not in meatiness, but in the unique, chewy, and collagen-rich texture of the skin, cartilage, and tendons – a textural experience highly valued in Chinese cuisine.2
The sheer scale of this culinary preference is staggering. China is estimated to consume a jaw-dropping 33.6 billion chicken feet annually. That’s nearly 100 million chicken feet every single day, accounting for approximately 80% of the entire global consumption of this product.3 This insatiable demand has created a massive domestic market. It also means that what often arrives in China as a relatively low-cost imported raw agricultural commodity undergoes a significant value transformation. Recently, the term “chicken feet assassins” (鸡爪刺客 – jīzhuǎ cìkè) has even trended on Chinese social media, referring to premium, often deboned and elaborately flavored, packaged chicken feet that can command surprisingly high prices. For instance, some branded lemon-flavored deboned chicken feet have been seen retailing for as much as 99 RMB per jin (a Chinese unit of weight equal to 500 grams), which translates to over US$13 per pound.3 While not all chicken feet reach such gilded prices – fresh, raw chicken feet in local markets might sell for 25-30 RMB per jin – this phenomenon underscores the strong domestic demand and the significant value-addition that occurs within China’s food processing and retail sectors.
Chicken Paws – An American Industrial Byproduct
The American perspective on chicken feet could hardly be more different. In the U.S., where the poultry industry is overwhelmingly geared towards producing chicken breasts, wings, and thighs for a market that prizes meatiness, chicken feet are largely considered an inedible byproduct.2 For most American consumers, they hold little to no culinary appeal. Consequently, if not exported, the destiny of billions of chicken feet annually is to be rendered down by processing plants into low-value components for animal feed or pet food.4
This cultural divergence has profound economic consequences. For U.S. poultry producers, the Chinese market represented a golden opportunity to transform a near-waste stream into a significant revenue generator. Exporting chicken feet to China could fetch prices ranging from $0.80 to $1.00 per pound.4 If sold domestically for animal feed, however, the value plummeted by as much as 90%, to a mere $0.05 to $0.10 per pound.4 This enormous price differential was the entire economic rationale underpinning the U.S.-China chicken feet trade. For major American poultry processors like Tyson Foods, this export channel was not insignificant. Losing it, as 4 estimated, could translate into annual losses approaching $250 million for a company of that scale. In 2022, for example, the U.S. exported approximately 133,700 metric tons of chicken feet to China, generating revenue of about $550.4 million.4 This byproduct, an afterthought in its home market, had become a billion-dollar export business thanks almost entirely to Chinese appetites. This reliance, born from differing cultural tastes, would prove to be a critical vulnerability. The high consumer valuation in China created a robust domestic value chain, motivating Chinese importers to secure supply and giving them leverage, a stark contrast to the U.S. where the product had minimal intrinsic market value.
A Fowl History: Setting the Stage for Conflict – From Avian Flu to Early Skirmishes
The U.S.-China chicken feet trade didn’t spring into existence overnight, nor did its recent troubles emerge from a vacuum. A look back reveals a history of significant U.S. supply dominance, punctuated by disruptions that foreshadowed later conflicts.
U.S. as a Dominant Supplier (Pre-Disruption)
For many years, the United States was a, if not the, cornerstone supplier of chicken feet to the massive Chinese market. Before the trade war and other major disruptions took full effect, U.S. poultry producers were shipping approximately 400,000 tons of chicken feet to China annually, a period primarily before 2015.5 To put this into perspective, this volume was equivalent to roughly 50 shipping containers packed with chicken feet every single day 5, illustrating a deeply entrenched and high-volume trade relationship. This established the U.S. as a key, almost indispensable, source for Chinese importers seeking the larger, fleshier “jumbo” paws often preferred by Chinese consumers over domestically produced varieties.6
The 2015 Avian Flu Ban – A Critical Turning Point
A pivotal moment that significantly altered this trade dynamic occurred in 2015. An outbreak of Highly Pathogenic Avian Influenza (HPAI) in the United States prompted China to impose a comprehensive ban on all U.S. poultry imports.5 While such bans are standard international practice in response to animal disease outbreaks, what was notable was the duration. The U.S. was officially declared free of this particular HPAI strain by August 2017. However, China was markedly slow to lift its import restrictions.5 The ban on U.S. poultry was only formally rescinded in November 2019.7 This nearly two-and-a-half-year lag between U.S. disease clearance and China reopening its market hinted that phytosanitary concerns might not have been the sole factor influencing Beijing’s trade policy. This period likely forced Chinese importers to begin earnestly developing alternative supply chains, a move that would prove strategically significant later. The prolonged ban, despite scientific clearance, could be seen as China testing its market’s ability to adapt without a key supplier, perhaps inadvertently (or intentionally) using SPS measures as a non-tariff barrier or for broader strategic signaling.
Earlier Trade Frictions – Poultry as a Precedent
Even before the avian flu ban and the subsequent Trump-era trade war, the U.S.-China poultry trade was not without its contentions. To provide a fuller historical context, it’s important to note the significant World Trade Organization (WTO) dispute that unfolded between 2009 and 2013. In 2010, China’s Ministry of Commerce (MOFCOM) imposed substantial anti-dumping (AD) duties, ranging from 50.3% to an astounding 105.4% for some U.S. producers, and countervailing duties (CVD) of 4.0% to 30.3% on U.S. broiler chicken products.8 This was, at the time, China’s first “dual-reverse” (anti-dumping and anti-subsidy) investigation against the U.S..9
The impact of these duties was immediate and severe: U.S. broiler exports to China plummeted by nearly 90%.8 The United States challenged these measures at the WTO. In 2013, a WTO dispute settlement panel largely ruled in favor of the U.S., finding that China’s imposition of duties was inconsistent with its WTO obligations and recommending that China bring its measures into conformity.8 This episode, however, established a clear precedent: poultry products were already a sensitive and highly contested area in U.S.-China commercial relations. It demonstrated China’s willingness to use trade remedy measures in this sector and the significant impact such measures could have on U.S. exports. This history suggested that poultry would likely be a recurring flashpoint in any future trade tensions, as both sides had a “playbook” from this earlier engagement.
The Claws Come Out: Tariffs, Retaliation, and the Peak of the Trade War
The historical frictions in the poultry trade set the stage for chicken feet to become embroiled in the much larger U.S.-China trade war that escalated significantly from 2018 onwards. As the Trump administration imposed sweeping tariffs on Chinese goods, citing unfair trade practices and intellectual property theft, China responded in kind, with U.S. agricultural products becoming prime targets for retaliation.10 Given their unique market dynamics and past history, chicken feet were inevitably caught in the crossfire.
The tariff onslaught was not a single event but a series of escalating measures that created a complex and increasingly costly environment for U.S. chicken feet exporters. A critical document for understanding this is the USDA Foreign Agricultural Service (FAS) report CH2025-0031, which includes a detailed “Table 2: Tariff Schedule for U.S. Chicken Meat and Chicken Paws”.12 This table meticulously outlines the various layers of tariffs applied to U.S. poultry products, including those under HS code 0207.14.22 for frozen chicken paws.
The timeline of key Chinese tariff impositions on U.S. chicken paws, based on this data and other corroborating sources, paints a clear picture of mounting pressure:
- July 6, 2018: China imposed an additional 25% tariff on a list of U.S. goods, including chicken products, in retaliation for U.S. Section 301 tariffs.12
- September 24, 2018: A further 10% additional tariff was applied to another list of U.S. products, which also encompassed poultry. This tariff was later subject to suspensions and reinstatements, adding to market uncertainty.12
- 2019: Additional tariffs continued, with, for example, a 5% tariff effective September 1, 2019, also experiencing periods of suspension and then reapplication.12
- March 10, 2025: A significant escalation occurred when China implemented an additional 15% tariff on a range of U.S. goods, specifically including chicken meat and, as listed under HS code 0207.14.22, frozen chicken feet.12 This date, appearing in multiple recent official announcements and reports, marks a recent intensification.
- April 10, 2025: Just a month later, China imposed a sweeping additional 34% tariff on virtually all remaining U.S. imports.12
The cumulative impact of these layered tariffs, as calculated in the USDA FAS Table 2 for HS 0207.14.22 (Frozen chicken paws), brought the total applied tariff to a staggering 70% on top of the existing Most Favored Nation (MFN) duty of 1.8 RMB/kg.12 Some reports from early May 2025 even cited Chinese retaliatory tariffs on U.S. goods reaching as high as 125% for certain product categories or as an overall measure, further underscoring the extreme tariff barriers U.S. products faced.20
The following table summarizes the tariff escalation specifically for U.S. frozen chicken paws:
Table 1: Escalation of Chinese Tariffs on U.S. Frozen Chicken Paws (HS 0207.14.22) During the Trade War
| Effective Date | Tariff Action Description | Additional Tariff Rate Imposed (%) | Cumulative Additional Tariff Rate (%) (Approx.) | Total Applied Tariff (Approx.) | Primary Source(s) |
| July 6, 2018 | Retaliation to U.S. Section 301 Tariffs (List 1) | 25% | 25% | 25% + MFN | 12 |
| Sept 24, 2018 | Retaliation to U.S. Section 301 Tariffs (List 2) | 10% | 35% | 35% + MFN | 12 |
| June 1, 2019 | Tariff rate adjustments (some items from 10% to 20%/25%) | Variable (up to +15% on prior) | Up to 50% | Up to 50% + MFN | 12 |
| Sept 1, 2019 | Retaliation to U.S. Tariffs ($75B list) | 5% or 10% (paws likely 5%) | Up to 55% | Up to 55% + MFN | 12 |
| Feb 14, 2020 | Phase One Deal tariff adjustments (some rates halved) | Rates reduced (e.g. 10% to 5%) | Reduced from peak | Reduced from peak + MFN | 12 |
| March 10, 2025 | New Retaliatory Tariff on specific U.S. goods (incl. chicken) | 15% | Reaches ~36% (base MFN + prior + new 15%) | ~36% + Specific Duty (1.8 RMB/kg) | 12 |
| April 10, 2025 | New Retaliatory Tariff on all U.S. goods | 34% | Reaches ~70% (base MFN + prior + new 34%) | ~70% + Specific Duty (1.8 RMB/kg) | 12 |
Note: MFN (Most Favored Nation) tariff for HS 0207.14.22 is 1.8 RMB/kg. Cumulative rates are approximate due to interactions of ad valorem and specific duties and suspensions/reinstatements not fully detailed here. The 2025 figures represent a significant re-escalation. Some sources (20) cite a 125% general retaliatory tariff by China around this period.
The market reaction to these punitive tariffs was, predictably, swift and severe. For example, in February 2025, as these new tariff threats loomed or began to take effect, U.S. chicken parts exports to China plummeted by 69.4% in volume and 47.9% in value compared to the same month in the previous year.23 This immediate and drastic downturn demonstrated how effectively these trade barriers could choke off U.S. access to the Chinese market. The compounding effect of these layered and often volatile tariffs created massive uncertainty, disrupting established trade flows and forcing rapid strategic recalculations by businesses on both sides. This volatility, a hallmark of the trade war, made long-term planning nearly impossible and incentivized Chinese importers to seek more stable, less politically fraught sources of supply. Furthermore, the targeting of agricultural products like chicken feet, which have a unique cultural demand in China but for which the U.S. is highly export-dependent, suggests a calculated Chinese strategy to exert pressure on specific, politically relevant U.S. sectors while leveraging its own ability to diversify imports of these particular items.
China’s Strategic Pivot: Diversification, Pricing Power, and Playing the Long Game
As U.S. chicken feet became increasingly burdened by tariffs and political uncertainty, China executed a masterful strategic pivot. This wasn’t merely a passive acceptance of higher prices; it was an active and aggressive reshaping of its import supply chains, demonstrating remarkable agility and a keen understanding of its own market power.
Aggressive and Successful Diversification of Supply Sources:
The most significant element of China’s strategy was its rapid diversification away from U.S. suppliers. This move effectively insulated its consumers from the full impact of the tariffs and simultaneously weakened the U.S.’s negotiating position for this specific commodity.
- Brazil Ascendant: Brazil quickly rose to become the primary beneficiary of this shift. Its overall market share for chicken product imports into China climbed from an already strong 65% in 2023 to a dominant 70% in 2024, according to USDA FAS data.12 The change was even more pronounced for frozen chicken paws specifically. Brazil’s exports of paws to China surged from approximately 175,000 metric tons in 2023 to an estimated 230,000 metric tons in 2024.12 The influential Huxiu article confirmed that by 2024, Brazil had definitively replaced the U.S. as China’s largest chicken feet supplier.1
- Russia’s Rapid Rise: Russia also emerged as a major player in an astonishingly short period. Its exports of chicken paws to China more than doubled, rocketing from roughly 50,000 metric tons in 2023 to around 100,000 metric tons in 2024.12 By the first ten months of 2024, Russia had solidified its position as China’s second-largest supplier of frozen chicken paws, shipping 80,000 tons valued at a significant $250 million.24
- Thailand and Others Seize the Opportunity: Thailand also saw its share of China’s overall chicken product imports increase, moving from 8% in 2023 to 11% in 2024.12 Its chicken paw exports to China effectively doubled, from approximately 10,000 metric tons to 20,000 metric tons over the same timeframe.12 Beyond these key players, other countries like Argentina 7 and various European nations, including Spain 1, also stepped in to capitalize on the void left by the increasingly uncompetitive U.S. product. This demonstrated a broad-based global supply response, orchestrated by China’s immense demand.
The speed and scale of this diversification are evident in the following data:
Table 2: The Great Shift: China’s Frozen Chicken Paw Import Sources (Volume in 1,000 MT & Estimated Market Share %)
| Supplier Country | Import Volume 2023 (1,000 MT) | Approx. Market Share 2023 (%) | Import Volume 2024 (1,000 MT) | Approx. Market Share 2024 (%) | % Change in Volume (2023-2024) | Primary Source(s) |
| Brazil | ~175 | ~42% | ~230 | ~51% | +31% | 1 |
| Russia | ~50 | ~12% | ~100 | ~22% | +100% | 12 |
| Thailand | ~10 | ~2% | ~20 | ~4% | +100% | 12 |
| United States | ~15 | ~4% | ~5 | ~1% | -67% | 12 |
| Others | ~165 (derived) | ~40% | ~95 (derived) | ~21% | -42% | |
| Total (Approx.) | ~415 | 100% | ~450 | 100% | 1 |
Note: 2023 market shares are estimated based on total imports of ~415,000 MT (derived from 2024 total minus U.S. 2023 share increase). 2024 total imports of nearly 450,000 MT from.1 “Others” volume is derived. This table clearly shows the U.S. being marginalized as Brazil and Russia surged.
Wielding Pricing Power – The “Reverse Squeeze” (倒推定价):
Beyond simply finding new suppliers, Chinese importers employed a shrewd pricing strategy. As detailed in the Huxiu article through the experiences of meat importer Xu Juan, they leveraged their significant buying power and the U.S. suppliers’ acute need to offload a product with few alternative markets.1 Faced with tariffs that would make U.S. chicken feet uncompetitive, Chinese importers successfully negotiated lower base prices from American producers. This “reverse push” or “倒推” (dàotuī) pricing effectively forced U.S. companies to absorb a substantial portion of the tariff costs themselves if they wished to retain any semblance of market access. This was possible because U.S. producers, knowing the minimal value of chicken feet domestically, were often desperate to make any export sale, even at reduced margins.1 The USDA FAS report 12 also shows that while U.S. paws commanded higher prices historically (around $5,400/MT in 2024), paws from Brazil ($3,800/MT), Russia ($3,200/MT), and Thailand ($3,600/MT) were significantly cheaper even before tariffs, making them highly attractive once tariffs further inflated U.S. prices.
Unyielding Consumer Demand and Aversion to Political Risk:
China’s enormous and unwavering domestic demand for chicken feet provided a constant impetus for importers to secure supply, regardless of origin.3 This strong internal market gave them leverage over U.S. suppliers who had few other places to sell such vast quantities at a premium. Furthermore, as the Huxiu article notes, the unpredictability of U.S. trade policy during this period led Chinese importers to increasingly favor suppliers from countries perceived as more stable and less politically volatile trading partners, further disadvantaging U.S. exporters in the long run.1 This proactive supply chain restructuring by a dominant buyer, coupled with the exploitation of a buyer’s market, showcased China’s ability to turn a trade challenge into a strategic realignment that ultimately served its interests.
The American Rooster Comes Home to Roost: Pain on the Plains (and in the Processing Plants)
The strategic maneuvers by China in the chicken feet trade had direct and painful consequences for U.S. poultry producers and the broader agricultural export sector. What was once a surprisingly lucrative market for an American byproduct quickly turned into a source of significant financial loss and operational disruption.
Quantifying the Devastating Impact on U.S. Exports:
The numbers tell a stark story of decline. U.S. frozen chicken paw exports to China, which stood at a significant 133,700 metric tons valued at $550.4 million in 2022 4, began a precipitous fall. Some industry analyses even placed the 2022 value of U.S. chicken feet exports to China closer to $935 million, constituting 85% of the total $1.1 billion in U.S. poultry exports to the country that year.6 Regardless of the precise valuation, it was undeniably a billion-dollar-level trade.
By 2023, the impact was becoming clear. Data for the first six months of 2023 showed U.S. frozen chicken feet sales to China had already dropped to $358.3 million (65,200 metric tons), a significant decrease from the previous year’s pace.6 The USDA FAS report CH2025-0031 painted an even bleaker picture for the subsequent period, with its Chart 10 indicating that U.S. frozen chicken paw exports to China plummeted from approximately 15,000 metric tons in 2023 (full year) to a mere 5,000 metric tons in 2024.12 This represented a collapse of what was once a vibrant export stream.
The overall U.S. market share for all chicken products in China reflected this downturn, slumping from 17% in 2023 to just 11% in 2024.12 The immediate aftermath of the 2025 tariff hikes was particularly severe: U.S. chicken parts exports to China in February 2025 crashed by 69.4% in volume and 47.9% in value compared to February 2024.23
The following table illustrates the sharp decline in U.S. chicken paw exports to China:
Table 3: The Decline of U.S. Frozen Chicken Paw Exports to China (Volume & Value)
| Year | Export Volume (Metric Tons) | Export Value (USD Million) | % Change in Value (YoY) | % Change in Volume (YoY) | Primary Source(s) |
| 2022 | 133,700 | $550.4 | – | – | 4 |
| 2023 (Jan-June) | 65,200 | $358.3 | N/A (Partial Year) | N/A (Partial Year) | 6 |
| 2023 (Full Year Est.) | ~15,000 | ~$81 (Est. @ $5.4k/MT) | ~ -85% | ~ -89% | 12 |
| 2024 (Full Year Est.) | ~5,000 | ~$27 (Est. @ $5.4k/MT) | ~ -67% | ~ -67% | 12 |
| Feb 2025 (vs Feb 2024) | – | -47.9% | – | -69.4% | 23 |
Note: 2023 and 2024 full-year values are estimated based on volumes from 12 and average price from.12 YoY changes for 2023/2024 are based on these estimates compared to 2022 actuals.
The Human and Corporate Cost in the U.S.:
This collapse in trade was not just an abstract statistical phenomenon; it had tangible impacts on American businesses and agricultural communities. The Huxiu article relayed accounts from Chinese importers, such as Xu Juan, who noted that numerous U.S. poultry factories, heavily dependent on Chinese orders for byproducts like chicken feet, intestines, and gizzards, were forced to shut down operations or drastically curtail production.1
Industry representatives voiced grave concerns. Greg Tyler, President and CEO of the USA Poultry & Egg Export Council (USAPEEC), stated unequivocally that the latest round of severe Chinese tariffs (some reports indicated retaliatory tariffs as high as 125% on U.S. goods 20) would likely cause U.S. export volumes of both chicken feet and other chicken meat to China to “approach zero”.20 This stark assessment from a leading industry body highlighted the perceived finality of the market loss.
The pain was also felt at the farm level. Davie Stephens, a farmer in Clinton, Kentucky, who raises broiler chickens for Pilgrim’s Pride, expressed deep anxiety about the loss of this crucial, albeit unconventional, export market. He, like many in the U.S. agricultural sector, recognized that China was a unique outlet for products like chicken feet and certain pork offal, items that have few, if any, alternative buyers willing to pay comparable prices.26
Major U.S. poultry processors, such as Tyson Foods, faced significant financial and operational repercussions. Beyond the direct loss of export revenue – with one estimate suggesting a potential $250 million annual hit for Tyson if all its paw exports to China were to cease 4 – these companies had to confront the logistical and financial challenge of dealing with a massive surplus of chicken feet. High-quality paws, once destined for human consumption in China, were now being downgraded to low-value animal feed grade. This not only represented a significant loss in value but also risked overwhelming their domestic animal feed processing facilities.4 While Tyson Foods’ overall chicken segment showed improved operating income in its Q2 2025 financial report due to a variety of market factors, the company explicitly acknowledged ongoing concerns about U.S. trade policies and the potential negative impact of tariffs on its export business.27
The Unpalatable Alternatives:
With the primary export market effectively shuttered, U.S. producers were left with grim choices for their mountains of chicken feet. They could either incur the costs of freezing and storing them indefinitely, a gamble on the faint hope that U.S.-China trade relations might dramatically improve in the future, or they could sell them for a pittance – a 90% reduction in value – to rendering plants for processing into animal feed or pet food ingredients.4 This situation underscored the acute vulnerability created by the U.S. poultry industry’s lack of a significant domestic market or readily available alternative export destinations for this particular byproduct. The combination of tariffs and, at times, HPAI-related restrictions from certain U.S. states (6) created a perfect storm, accelerating China’s diversification and leaving U.S. producers to bear the brunt of a trade war fought with unconventional weapons.
VII. Beyond the Coop: Lessons from the Chicken Feet Feud – Market Power, Vulnerabilities, and Global Shifts
The U.S.-China chicken feet trade war, while seemingly a niche skirmish, offers profound lessons about the evolving dynamics of global commerce, the strategic use of market power, and the vulnerabilities inherent in certain trade relationships.
China’s Consumer Market as a Geopolitical Tool: This episode vividly demonstrates how a nation possessing a massive, specific, and relatively inelastic consumer demand for a particular product can wield that market access as significant leverage in broader trade disputes.1 China’s immense appetite for chicken feet, a product with limited appeal elsewhere, gave it outsized influence over the global trade of this item. By threatening or imposing restrictions, China could directly impact a segment of the U.S. agricultural economy. This serves as a case study in how consumer preferences, when aggregated on a national scale, can translate into tangible geopolitical power.
Vulnerability of Niche Product Exports: The experience of U.S. chicken feet exporters underscores a critical point: industries that become heavily reliant on a single foreign market for niche products, especially byproducts, are exceptionally vulnerable to policy shifts in that importing country.4 The U.S. poultry industry found a highly profitable outlet in China for what was domestically a low-value item. However, this concentration of demand in one market created a dependency that proved perilous when that market became adversarial. The lack of viable alternative markets capable of absorbing similar volumes at comparable prices amplified the damage caused by Chinese tariffs.
Supply Chain Agility and the Challenge of Regaining Lost Markets: The speed and efficacy with which countries like Brazil and Russia ramped up their chicken feet exports to China highlight the dynamism and responsiveness of global agricultural supply chains.1 When a dominant supplier (the U.S.) was effectively priced out, other nations quickly stepped in to fill the void. This agility, while beneficial for the importing nation, poses a significant challenge for the supplanted exporter. Once market share is lost and new supply relationships are solidified, it can be exceedingly difficult and costly to regain that previous position, even if the original trade barriers are eventually lowered. Importers develop new logistical pathways, contracts, and trust with alternative suppliers, creating inertia against reverting to former partners.
The “Political Risk” Premium in International Trade: The chicken feet saga also illustrates that importers are increasingly factoring political stability and policy predictability into their sourcing decisions. The Huxiu article explicitly mentions that Chinese importers grew wary of the uncertainty surrounding U.S. trade policy and began to favor suppliers from countries perceived as offering more stable and reliable trading partnerships.1 In essence, U.S. products, during the height of the trade war, carried a “political risk premium” that made them less attractive, even independent of the direct cost of tariffs.
The Limits of Formal Dispute Resolution in Politically Charged Trade Wars: While the United States had previously won a WTO case against China concerning anti-dumping and countervailing duties on broiler meat in 2013 8, such formal dispute resolution mechanisms offered little immediate recourse or relief in the context of the broader, politically driven retaliatory tariffs of the more recent trade war. Market realities, national strategic interests, and the sheer scale of the political conflict often overshadowed the established rules-based trading system, at least in the short to medium term.
The chicken feet feud is a compelling illustration of how cultural culinary preferences, when combined with the economics of byproduct utilization and the realities of geopolitical maneuvering, can create unexpected and significant trade outcomes. It serves as a potential cautionary tale for other nations and industries, suggesting that over-reliance on a single dominant market for niche exports carries inherent risks. Moreover, it may encourage other large importing nations to consider similar strategic diversification if they find themselves in comparable trade disputes, potentially reshaping global trade flows for other specialized commodities. For exporting nations like the U.S., it underscores the long-term strategic importance of market diversification, not just for primary agricultural products, but also for the byproducts that contribute to overall economic viability.
VIII. Conclusion: The Lingering Taste of the “Paw War” – Who Really Won, and What’s Next?
When the dust settles on this peculiar chapter of the U.S.-China trade conflict, the question of “who won” the chicken feet war depends heavily on the metric of success. From the narrow perspective of the chicken feet trade itself, China demonstrably achieved its primary objectives. It successfully weathered the storm of U.S. tariffs on its goods by retaliating effectively against a vulnerable U.S. export. More strategically, China managed to secure its domestic supply of a culturally popular food item by rapidly diversifying its import sources, primarily turning to Brazil and Russia.1 This shift not only ensured a continued flow of “phoenix claws” to Chinese consumers but also minimized the inflationary impact of U.S. tariffs, partly by compelling U.S. suppliers to absorb costs and partly by sourcing from more price-competitive alternatives.1 In doing so, China dealt a significant economic blow to a specific segment of the U.S. agricultural sector, showcasing its ability to leverage its market power.
For U.S. poultry producers, the outcome was unequivocally negative. A once highly profitable, billion-dollar-level export channel for a byproduct with minimal domestic value was decimated.4 Factories faced closures, farmers worried about their livelihoods, and major corporations had to write off significant potential revenue.1 The U.S. industry was left scrambling for alternatives that simply didn’t exist on a comparable scale, forced to downgrade a valuable export into low-grade animal feed.4
There’s a profound irony in this situation: a product that most Americans discard without a second thought became an instrument of economic statecraft and a surprisingly sharp tool in a global trade confrontation. The “paw war” serves as a compelling, if small-scale, lesson in economic sovereignty and the pragmatic pursuit of national interest in an increasingly complex globalized world. When faced with broader trade pressures, China identified a U.S. vulnerability and exploited it with precision, prioritizing its consumers’ access to a desired product and its broader strategic trade positioning over maintaining a specific supplier relationship that had become politically and economically fraught.
For an American audience seeking to understand the multifaceted nature of U.S.-China relations, the chicken feet saga offers a uniquely insightful, albeit unconventional, lens. It underscores that the dynamics of this critical bilateral relationship are not always defined by high-tech competition or battles over major industrial sectors. Sometimes, the most illuminating stories – those that reveal underlying strategies, vulnerabilities, and the real-world consequences of policy decisions – are found in the most unexpected places, even in a humble container of frozen chicken feet.
Looking ahead, the long-term impact may well be a permanent realignment in global chicken feet trade flows. U.S. producers could find it exceptionally challenging to recapture their once-dominant market share in China, even if tariffs are eventually normalized. Trust has been eroded, and new, resilient supply chains have been forged with Brazilian, Russian, and other international suppliers who are likely to vigorously defend their newfound positions.1 As U.S.-China relations continue their complex evolution, one might ponder: what other “chicken feet” are out there? What other overlooked products, niche dependencies, or asymmetrical trade relationships could become the pressure points of tomorrow? The curious case of the chicken feet trade war suggests that in the intricate dance of global economics and geopolitics, no detail is too small to matter.
References:
- 中美鸡爪贸易大战,中国赢了-虎嗅网, 访问时间为 五月 19, 2025, https://www.huxiu.com/article/4352463.html
- 日媒:从鸡爪到鱼头,中国不买,美农民犯愁, 访问时间为 五月 19, 2025, http://news.china.com.cn/2025-05/12/content_117869548.shtml
- 山东省畜牧兽医局畜牧要闻鸡爪身价暴涨养鸡业迎来新的挑战与机遇?, 访问时间为 五月 19, 2025, http://xm.shandong.gov.cn/art/2024/7/26/art_24614_10338207.html
- 美国《福布斯》杂志:让鸡爪“重返”中国市场_中国网 – 中国网新闻中心, 访问时间为 五月 19, 2025, http://news.china.com.cn/2025-05/14/content_117873685.shtml
- 鸡爪与中美贸易战 – S³ Group, 访问时间为 五月 19, 2025, https://www.groups3.com/zh-hans/%E9%B8%A1%E7%88%AA%E4%B8%8E%E4%B8%AD%E7%BE%8E%E8%B4%B8%E6%98%93%E6%88%98/
- The Rise and Fall of U.S. Chicken Feet in China: A Story of Bird Flu and Trade Bans, 访问时间为 五月 19, 2025, https://southernagtoday.org/2023/09/07/the-rise-and-fall-of-u-s-chicken-feet-in-china-a-story-of-bird-flu-and-trade-bans/
- 前10个月我国冻鸡进口同比增加近5成 – 海关总署, 访问时间为 五月 19, 2025, http://shanghai.customs.gov.cn/eportal/fileDir/customs/resource/cms/article/333551/2810935/2019123119202397294.doc
- World Trade Organization Adopts Report Ruling in Favor of the …, 访问时间为 五月 19, 2025, https://ustr.gov/about-us/policy-offices/press-office/press-releases/2013/september/WTO-ruling-favor-US-chicken-China
- 中国对美国白羽肉鸡征30.3%反补贴税 – 房地产财税网, 访问时间为 五月 19, 2025, http://www.fdctax.com/cms/ztxw/2199.htm
- 中美贸易战- 维基百科,自由的百科全书, 访问时间为 五月 19, 2025, https://zh.wikipedia.org/zh-cn/%E4%B8%AD%E7%BE%8E%E8%B4%B8%E6%98%93%E6%88%98
- 美中貿易戰- 維基百科,自由的百科全書, 访问时间为 五月 19, 2025, https://zh.wikipedia.org/zh-tw/%E4%B8%AD%E7%BE%8E%E8%B4%B8%E6%98%93%E6%88%98
- Report Name: Poultry and Products Semi-Annual, 访问时间为 五月 19, 2025, https://apps.fas.usda.gov/newgainapi/api/Report/DownloadReportByFileName?fileName=Poultry%20and%20Products%20Semi-Annual_Beijing_China%20-%20People%27s%20Republic%20of_CH2025-0031
- Peoples Republic of China Announces Increases to Additional Tariffs on U.S. Agricultural Products, 访问时间为 五月 19, 2025, https://apps.fas.usda.gov/newgainapi/api/report/downloadreportbyfilename?filename=China%20Announces%20Increases%20to%20Additional%20Tariffs_Beijing_China%20-%20Peoples%20Republic%20of_9-18-2019.pdf
- Peoples Republic of China Announces Increases to Additional Tariffs – USDA Foreign Agricultural Service, 访问时间为 五月 19, 2025, https://apps.fas.usda.gov/newgainapi/api/report/downloadreportbyfilename?filename=China%20Announces%20Increases%20to%20Additional%20Tariffs_Beijing_China%20-%20Peoples%20Republic%20of_8-28-2019.pdf
- 2025关税升级时间线:关键政策节点,食品跨境合规需了解 – 北京海关, 访问时间为 五月 19, 2025, http://beijing.customs.gov.cn/beijing_customs/ztzl1/jgjmzl/gzld43/6464584/index.html
- 中国反击!对美部分进口商品加征10%、15%关税,包括鸡肉、玉米、大豆等 – 华尔街见闻, 访问时间为 五月 19, 2025, https://wallstreetcn.com/articles/3742306
- 对原产于美国的部分进口商品加征15%关税商品清单(2025年3月10日起实施) – 海关律师网, 访问时间为 五月 19, 2025, https://www.customslawyer.cn/portal/news/detail/id/65552.html
- China to impose additional tariff on some US products | english.scio.gov.cn, 访问时间为 五月 19, 2025, http://english.scio.gov.cn/pressroom/2025-03/04/content_117745246.html
- 中方宣布:对原产于美国的所有进口商品加征关税, 访问时间为 五月 19, 2025, http://us.china-embassy.gov.cn/zmgx_1/zxxx/202504/t20250404_11588741.htm
- 美国农民发愁:鸡爪、鱼头…除了中国,好难找到买家-观察者网, 访问时间为 五月 19, 2025, https://www.guancha.cn/internation/2025_05_09_775170.shtml
- 特朗普政府时期中美贸易冲突对纺织品贸易影响复盘, 访问时间为 五月 19, 2025, https://pdf.dfcfw.com/pdf/H3_AP202411131640849812_1.pdf?1731485213000.pdf
- US-China trade war tariffs: Underlying data, 访问时间为 五月 19, 2025, https://www.piie.com/sites/default/files/2023-04/us-china-trade-war-tariffs.xlsx
- Chicken exports to China sharply lower since last year – Meatingplace.com, 访问时间为 五月 19, 2025, https://www.meatingplace.com/Industry/News/Details/118593
- 俄罗斯成为中国第二大冷冻鸡爪供应国1-10月进口8万吨总额2.5亿美元 – 绥芬河市人民政府, 访问时间为 五月 19, 2025, https://www.suifenhe.gov.cn/sfh/c101023/202412/c03_986038.shtml
- U.S. exports of chicken feet to China slipped after major surge – Meatingplace.com, 访问时间为 五月 19, 2025, https://www.meatingplace.com/Industry/News/Details/111535
- U.S. farmers sell products in China they have trouble selling elsewhere. Will tariffs change that? – Marketplace, 访问时间为 五月 19, 2025, https://www.marketplace.org/story/2025/04/09/chicken-feet-tariffs
- Tyson Foods beats quarterly profit estimates, chicken sales rise – Energy News, 访问时间为 五月 19, 2025, https://energynews.oedigital.com/mineral-resources/2025/05/05/tyson-foods-beats-quarterly-profit-estimates-chicken-sales-rise
评论